

Stack:
Python · HTML · CSS · JavaScript
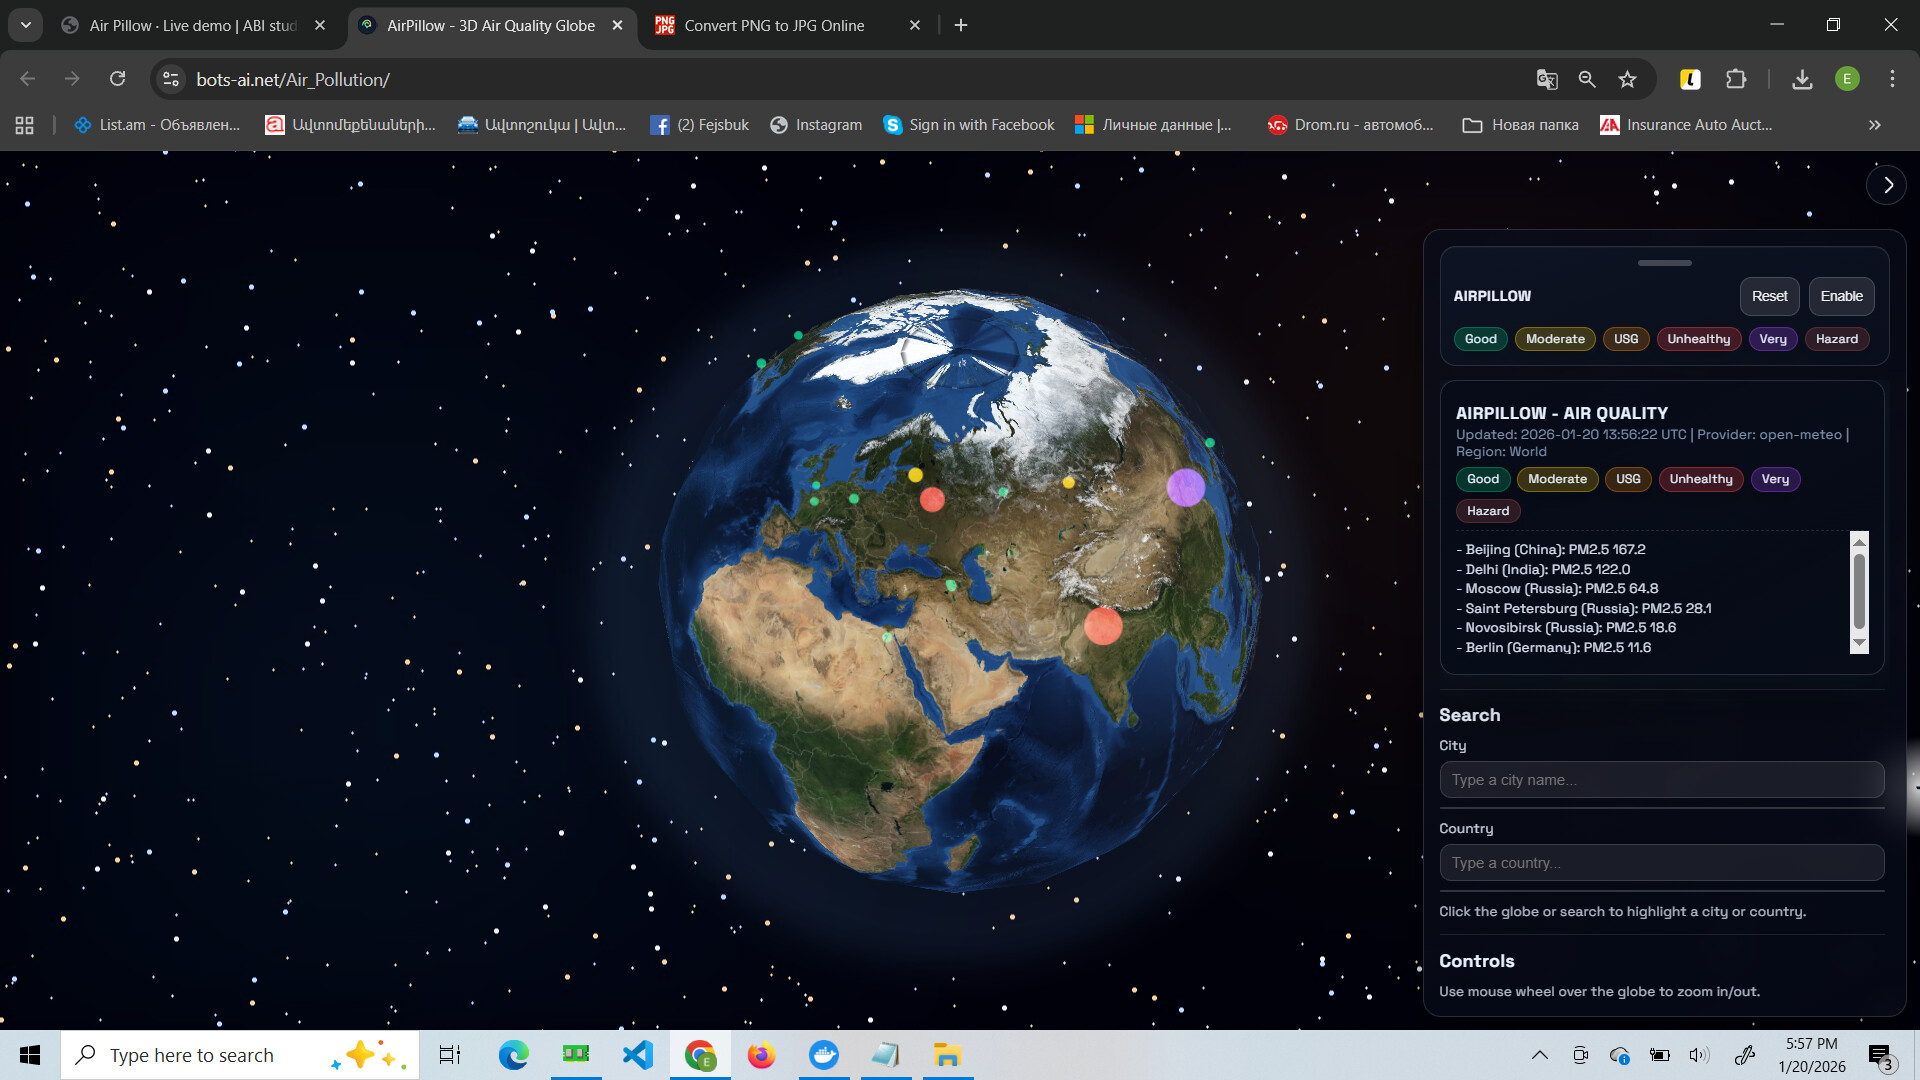
AirPillow is an interactive web page with a 3D air-quality globe, where pollution levels are shown using a color scale (Good / Moderate / USG / Unhealthy / Very Hazard). You can click on the globe or use the city/country search to highlight a location and quickly assess the current conditions.
Stack:
Python · HTML · CSS · JavaScript
API:
FastAPI (HTTP + WebSocket)
Integrations:
Open-Meteo API · OpenAQ API
Outputs:
Browser UI · MJPEG stream
Open the AirPillow site in your browser — the 3D air-quality globe loads.
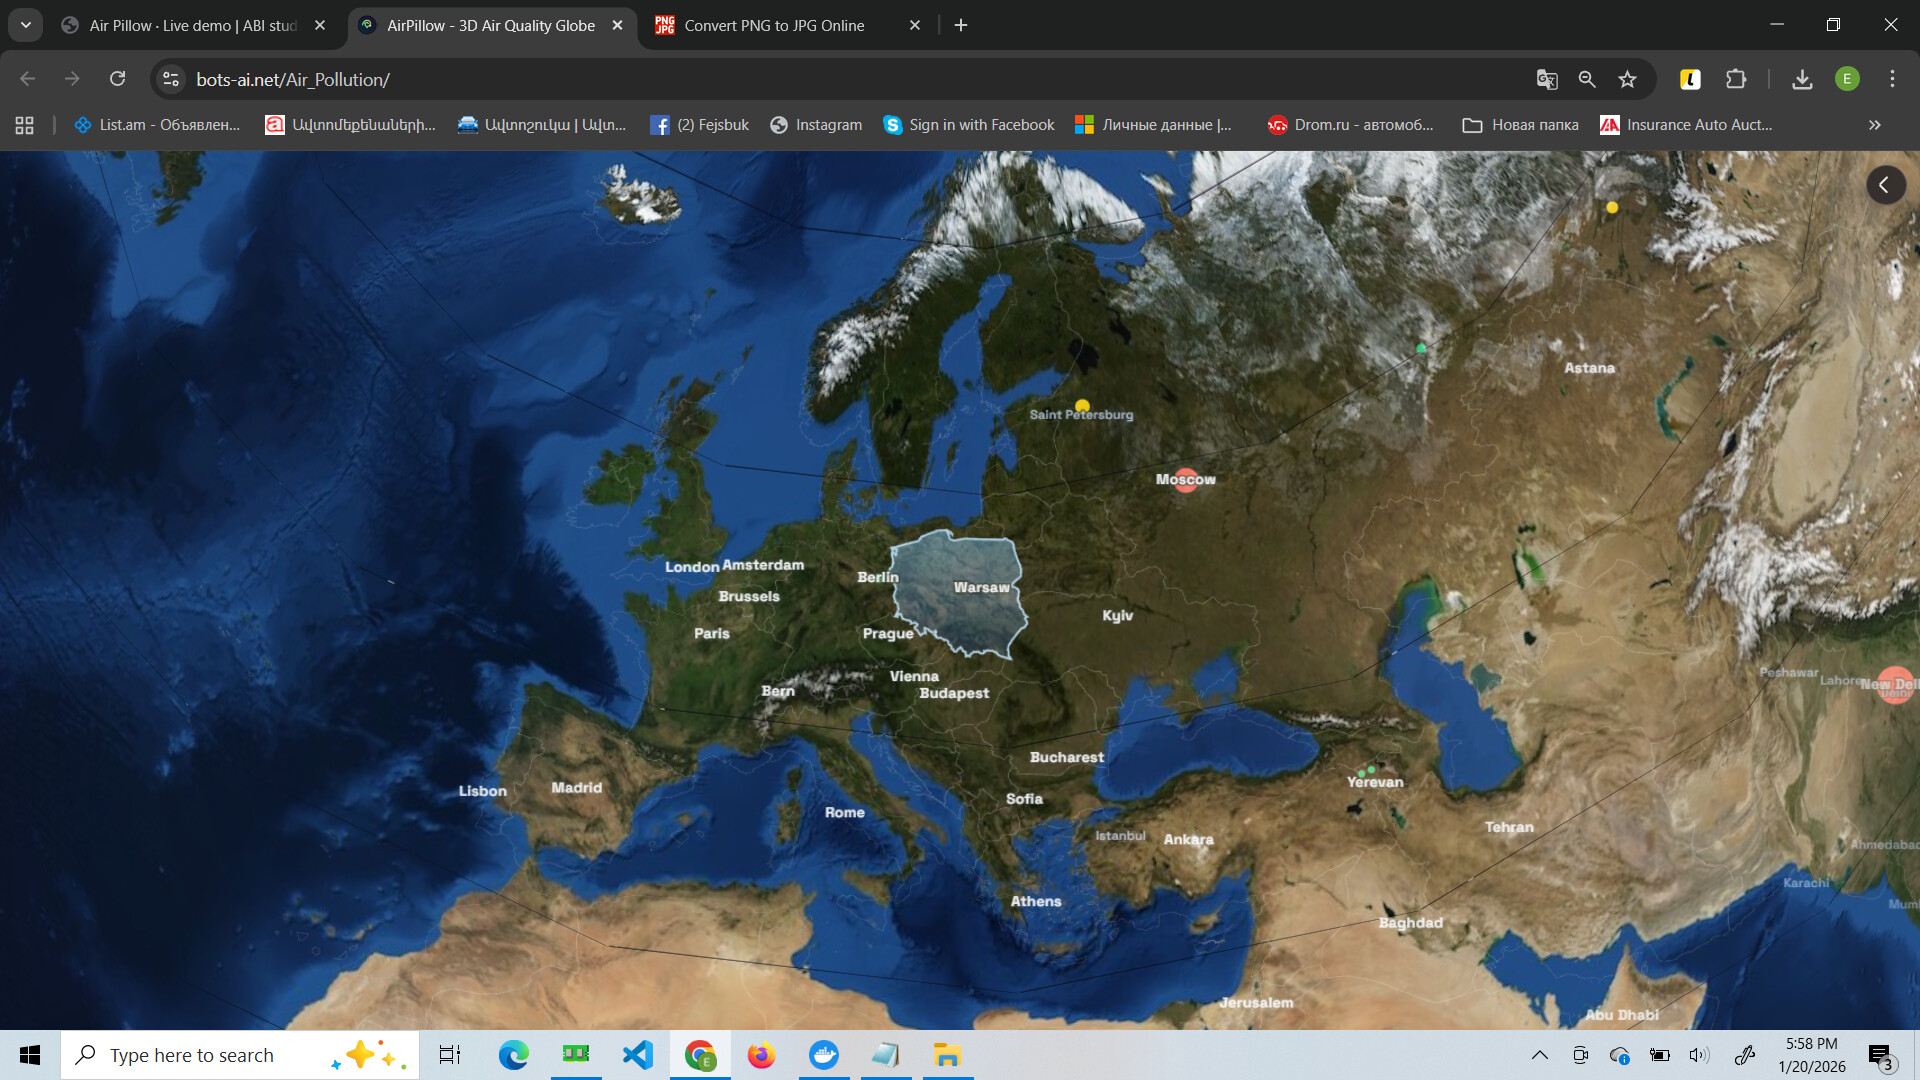
Drag to rotate the globe; use the mouse wheel to zoom in/out.
Check the legend/color scale (Good → Very Hazard) to understand pollution levels.
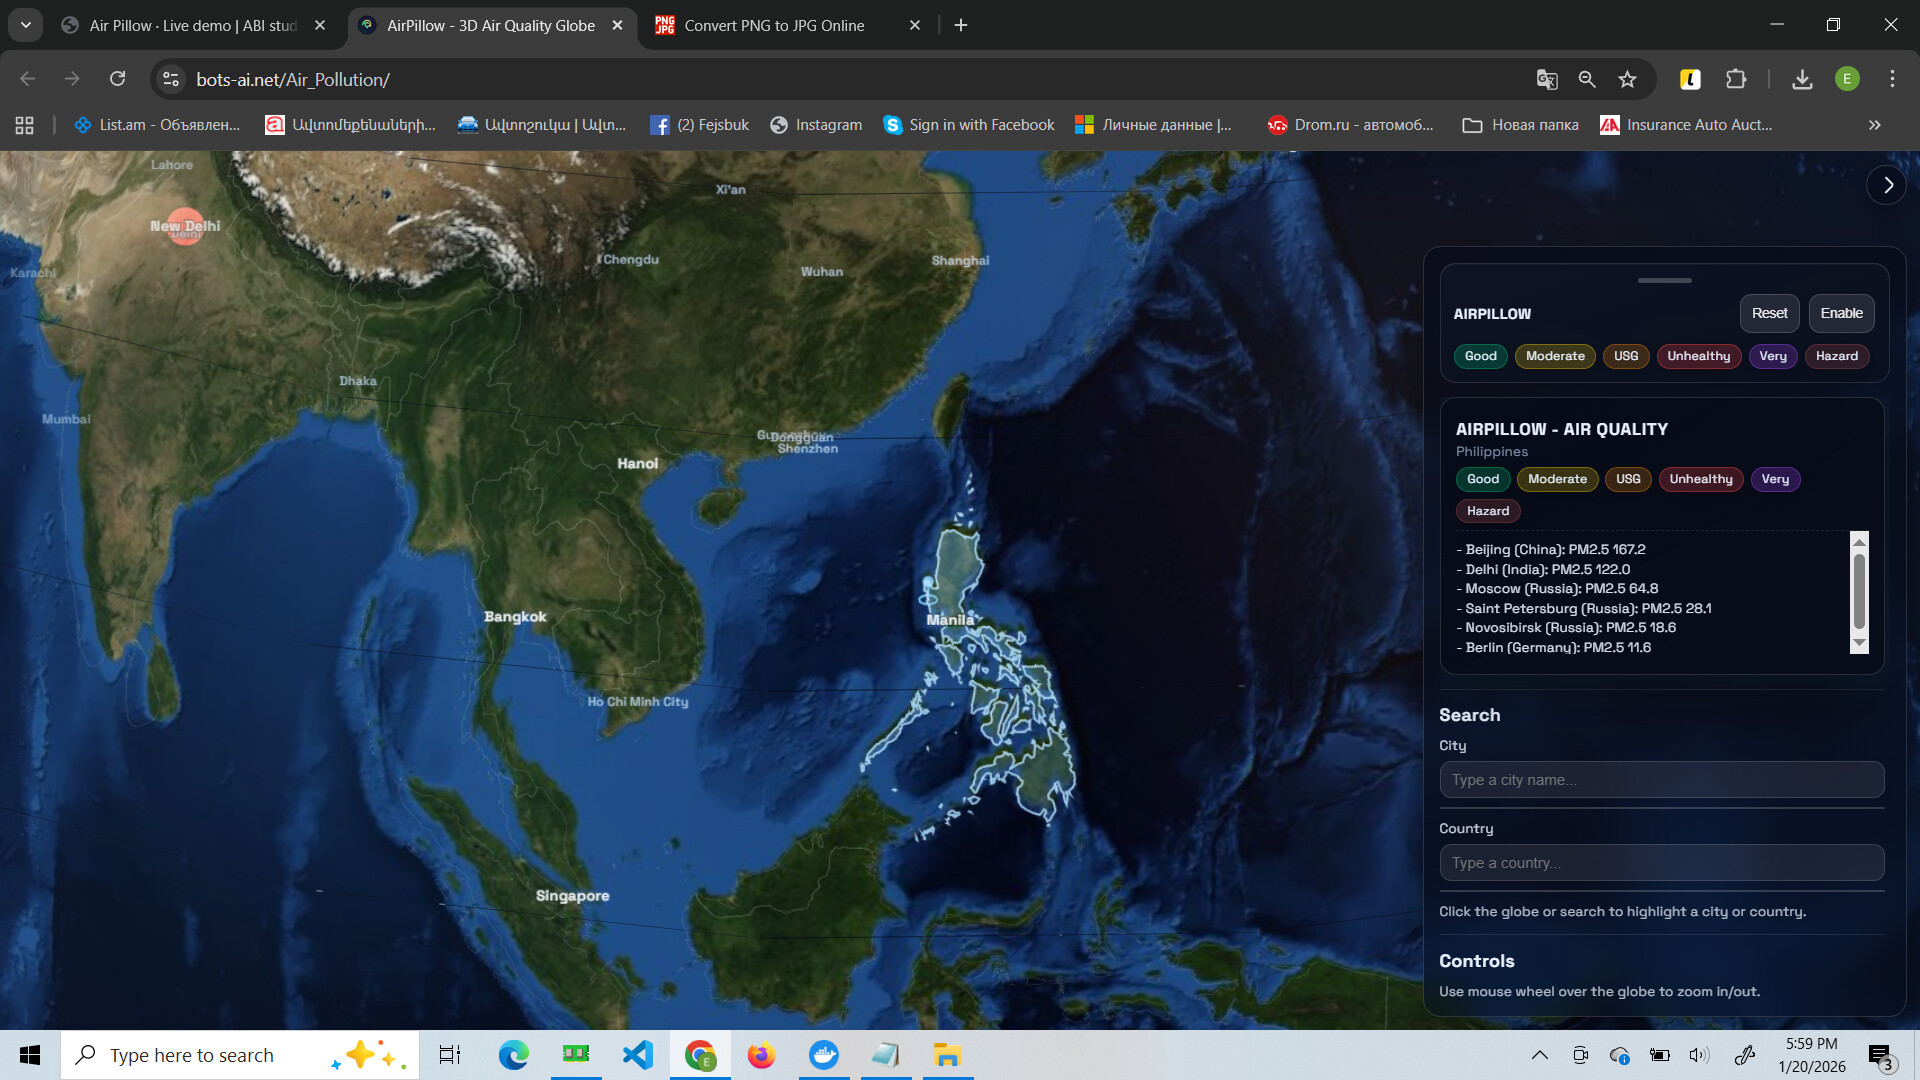
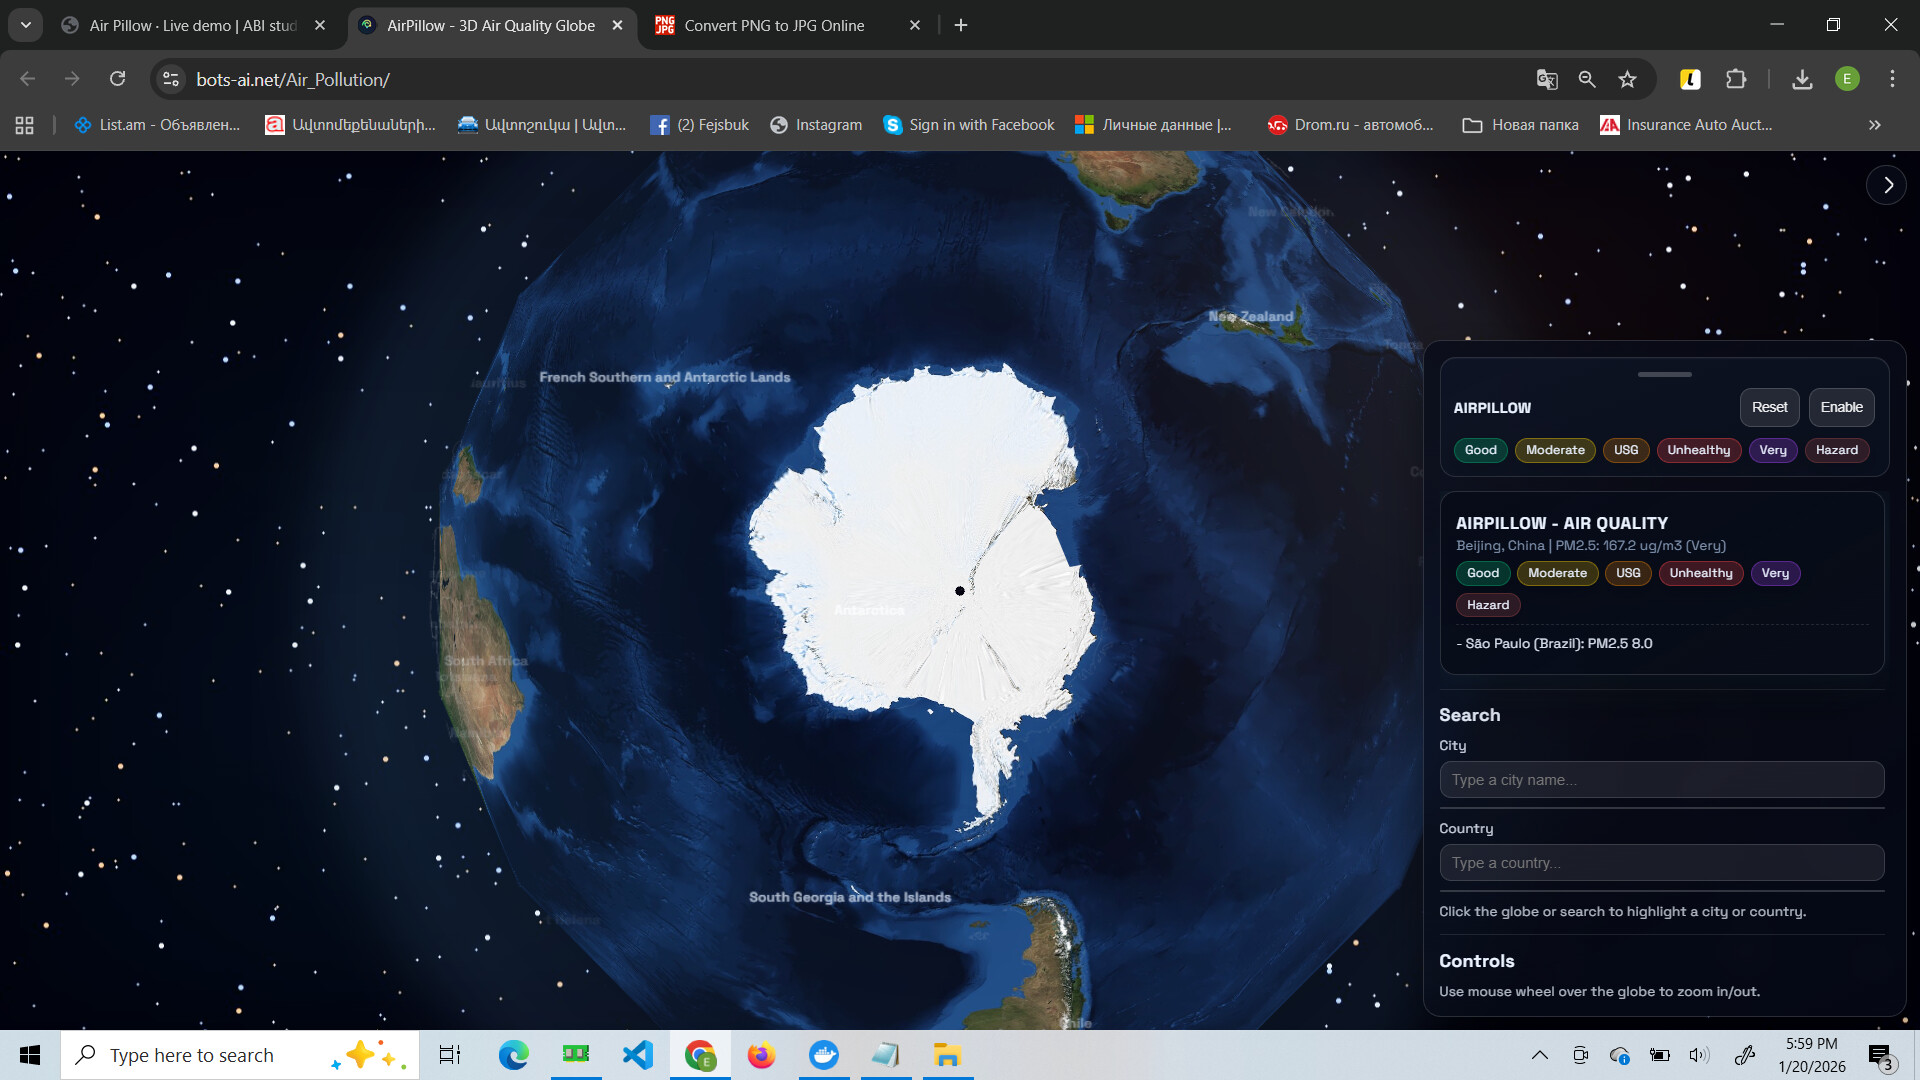
Click a point on the globe — the system highlights the location and shows its data.
Or type a city/country in the search field — the globe navigates to and highlights the match.
Click Reset (if available) to clear the selection/view and test another location.